Metrological verification of the DACHCZ limits
The growth of distributed generation and new device technologies (e.g., electric vehicles) is driving profound changes in power grids. In addition, future grids are characterized by lower and more volatile short-circuit power, making it more likely that degradation of power and voltage quality will have a significantly greater impact on efficient and stable operation than in the past. However, many studies and field trials are limited to efficiency and stability at grid frequency and do not consider the impact of grid feedback, or consider it inadequately.
Almost all installations for the generation, consumption or storage of electrical energy cause grid perturbations. Devices with power electronics, for example, lead to harmonics, and single- or two-phase connected devices lead to asymmetries. This reduces power and voltage quality and can interfere with the operation of other devices and equipment. Therefore, it is important to reliably quantify the grid compatibility of an installation to ensure reliable and efficient grid operation and to comply with electromagnetic compatibility requirements.
Today, the feedback effect of installations on the grid voltage is calculated before they are connected to the grid based on empirical values and guidelines. Metrological proof of compliance with the limit values is either not provided at all or only by means of procedures based on simplifying assumptions. This can lead to unexpected disturbances occurring during the operation of a plant, which affect the operation of the grid. On the other hand, possibly expensive remedial measures (e.g. filters) are already demanded during the planning stage, which would actually not have been necessary during operation of the plant.
By applying new methods and indices, the iREF Grid project determined a method for continuously monitoring the contribution of a single plant to voltage distortion. Through comprehensive and systematic measurements in cooperation with nine Swiss grid operators, different methods were evaluated and the optimal method was identified. As a result, interactions (e.g. compensation effects) can be determined more precisely in order to reliably identify plants with unacceptably high grid perturbations or to avoid investments in unnecessary remedial measures. This will make a lasting contribution to more efficient use of the grid infrastructure, more effective integration of new technologies and more reliable operation of future grids. The results also make an important contribution to the improvement of guidelines and standards.
Project goals and questions
Interference emission limits for a plant are calculated in the planning phase using methods from relevant guidelines and standards (e.g. DACHCZ guidelines for the assessment of grid perturbations). These methods are based on assumptions and simplifications, which usually lead to rather conservative limit values that do not efficiently utilize the absorption capacity of the grids with respect to grid back-impacts and are often difficult to meet by customers and only with higher investments. Emission limits can be expressed as voltages or currents. The voltage limits are often so low that they cannot be verified at all or only with difficulty by measurement after commissioning of the plant. For this reason, today compliance with specified limit values is often assessed by measuring the corresponding current at the point of connection (PCC). In practice, this measurement is often not carried out at all or only for a short period (e.g. several days to a week) directly after commissioning of the plant.
Due to interactions between the grid and the plant, the measured current consists of two components: one caused by the grid (responsibility of the grid operator) and one caused by the plant (responsibility of the customer). Intentional or accidental compensation effects as well as low simultaneity of the disturbance emission of several plants may lead to a smaller negative or even positive influence on the corresponding voltage quality parameter than the measured current suggests. An overly conservative assessment of the contribution by one plant may lead to inefficient use of the available absorption capacity or to unnecessary installation of mitigation measures. Especially in the case of random compensation, the contribution by the plant may change significantly over time due to changes on the grid side (e.g., change in switching condition or replacement of a transformer) or the customer side (e.g., replacement of equipment or expansion of the plant).
A device for the continuous metrological quantification of the contribution of a plant to the voltage quality, which takes into account the challenges described, did not exist so far, but is urgently needed for a proper determination of the grid repercussions of a plant. This is also confirmed by the ongoing discussions in international working groups and between customers and grid operators. Especially when the measured power output exceeds specified limits, there is no clear framework on how to determine the actual contribution to the reduction of power quality in a transparent way for both sides.
The objective of the iREF-Grid project was to develop and validate a method for continuous assessment of a plant’s contribution to voltage harmonics and its proof-of-concept implementation in an existing power quality instrument (Class A). The applicability of some promising methods and indices was tested and evaluated in terms of simplicity, transparency and effectiveness, among others, through extensive field tests with several Swiss grid operators. The results of the measurements were analyzed and discussed with the grid operators in order to identify the best method to accurately determine the contribution of a plant to the reduction of voltage quality. This will lead to a more efficient utilization of the hosting capacity of future grids in terms of harmonics and asymmetry, also taking into account an increasing temporal variability of the hosting capacity. In addition, guidelines for assessing the contribution of a plant to harmonics in the grid have been developed and have been incorporated into the revision of the DACHCZ guidelines for assessing grid feedback.
In principle, the measuring device can be applied not only to systems with several devices, but also to individual devices such as chargers for electric vehicles or PV inverters. It can be used in all grid levels, whereby the accuracy of the current and voltage transformers used must be ensured for the measurement of harmonics (frequency-dependent transmission behavior).
Metrological verification in the DACHCZ
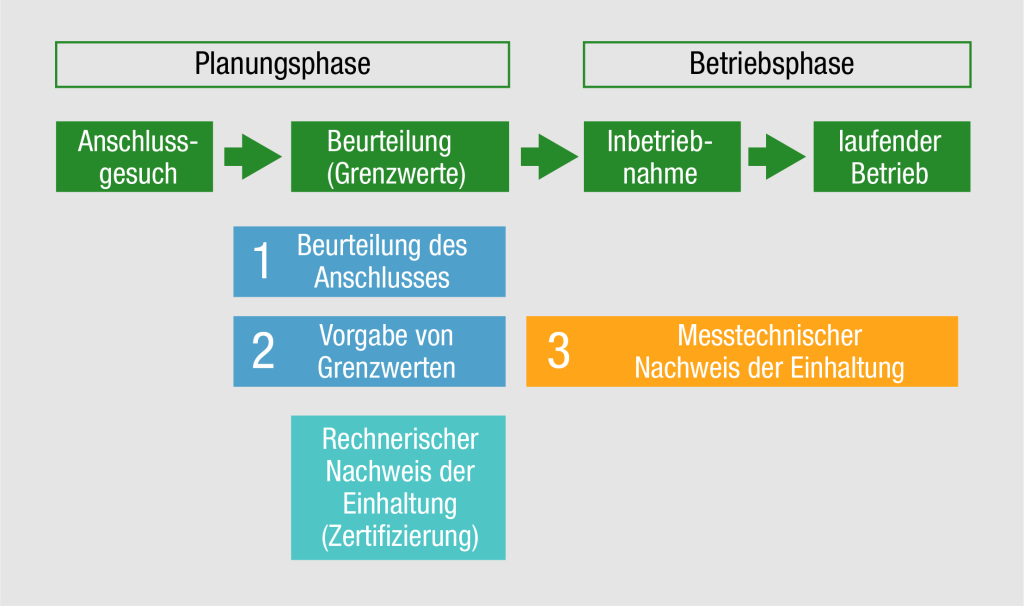
Up to now, metrological proof of compliance with limit values has not been provided at all or only by means of simple procedures based on a number of simplifying assumptions. In the current DACHCZ (3rd edition 2021), reference is made to this topic in chapter 2.9 Measurement and the type and scope of the measurement as well as the measurement procedure according to IEC 61000-4-30 are discussed. Figure 1 serves for a better understanding of the classification of the metrological verification in the connection assessment.
Evaluation framework
As part of the iREF-Grid project, a clear and easy-to-use framework for assessing harmonic emission from equipment in low and medium voltage grids in terms of harmonic currents and voltages was developed and applied to a series of field measurements.
The assessment procedure shown in Figure 2 consists of Stages A and B. In Stage A, the harmonic current emission is evaluated based on the 95th percentile for aggregated 10-minute data and based on the 99th percentile for aggregated 3-s data (if measured). If the respective percentile value is below the corresponding harmonic emission limit, the facility meets the requirements for that harmonic order. If the respective percentile value is above the current limit value for harmonic emissions by a factor (factor 2 was selected here), the plant does not meet the requirements in this harmonic order. In all other cases, the voltage harmonic emission must be evaluated in Level B. However, it may be useful to carry out the evaluation of the voltage harmonic emission even if the equipment meets or does not meet the requirements in stage A.
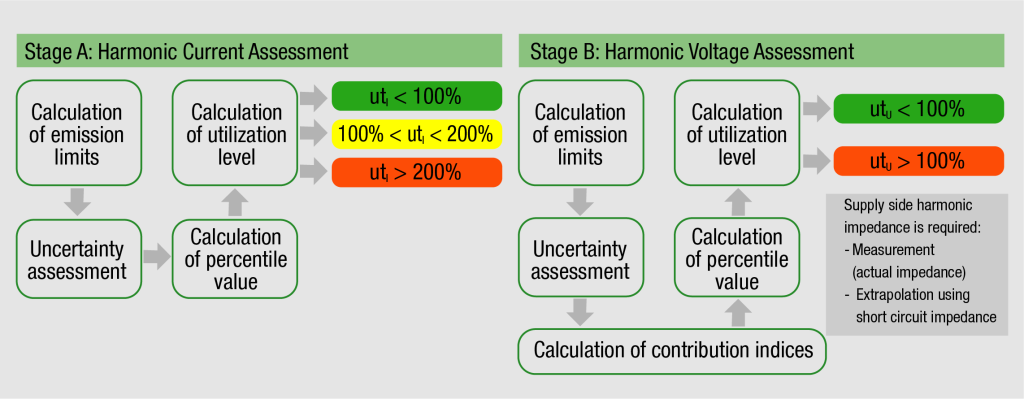
In stage B, the harmonic emission of the voltage is evaluated. In general, two evaluation indices can be applied. The first index (magnitude index) assumes a target diversity (extinction) and does not take into account any deviation (higher or lower) in diversity between the harmonic emission of the equipment in question and the background distortion. The second index (difference index) considers the actual diversity during the measurement. The grid operator must decide which of the indices to apply. Similar to stage A, the percentile values of the indices for the voltage harmonic emission are calculated and compared with the corresponding limit value, the decision on the compliance of the installation is made for each harmonic order.
Field measurements
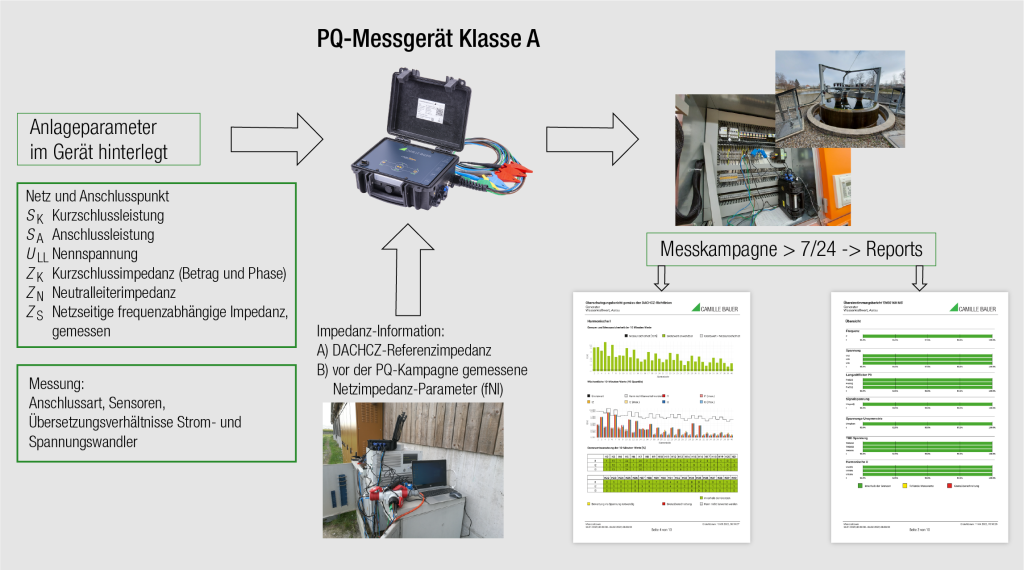
After evaluating the most suitable method under laboratory conditions, the method was tested for practicality at 52 measurement sites, with 34 LV, 17 MV, 1 HV and a mix of consumers, storage, prosumers and generators. For this purpose, the newly developed method was implemented in a Class A power quality analyzer certified by Metas (Fig. 3).
The measurements at the distribution grid operators were carried out according to a uniform process:
- Joint determination of the measurement locations.
- Provision of the plant paramaters by the distribution grid operator.
- Measurement of the grid impedance or use of a reference impedance and transfer of this information to the PQ measuring device.
- Installation of the measuring equipment by the grid operator’s specialists.
- Execution of the measurement capaign, in minimum 7/24.
- Generation of the conformity reports DACHCZ and EN 50160.
- Discussion of the measurement results with the respective grid operator.
Results and benefits for grid operators
The grid operator can now provide reliable information on real emissions even without in-depth methodological knowledge and no longer has to settle for incomplete theoretical considerations.
The disturbances that occur in the neutral conductor are also taken into account in the analysis. This is especially relevant for customers who are some 100 m away from the transformer. This aspect was not given sufficient attention in DACHCZ Ed. 3.
The metrological proof helps with the approval of the connection application of a plant. In the event of customer complaints, the originator can be clearly identified.
There is a risk if the customer’s emissions are not measured or only EN 50160 is taken into account. If an installation already uses a large part of the emissions allocated to the grids, there are not enough emission credits available for other or future installations.
User friendliness
In Switzerland, there are various grid operators, ranging from small companies in which individuals perform many tasks to grid operators that have grid quality specialists. Especially smaller companies are not able to perform a DACHCZ evaluation based on raw data. Thanks to the new procedure, the grid operator now no longer needs in-depth knowledge to perform the analysis. It is also no longer necessary to know all parameters. Missing parameters are replaced by default values that the grid operator can adjust to best reflect his situation. He then starts a series of measurements and at the end can generate an analysis report at the push of a button. The advantage over offline analysis is that the results are available immediately, long download times (for raw data) are avoided and more data can be recorded over longer periods.
Two reports with one device
With a PQ device, it is now possible to generate both an EN 50160 report and a DACHCZ (Ed. 3) harmonic compliance report. This ensures that even if EN 50160 is complied with, the necessary fault margins are available for future customers of the grid operator. The two reports form a good basis for in-depth discussion of selected PQ topics and are formal evidence in the event of customer complaints.
This PQ device helps the grid operator to provide metrological proof in order to be able to demand compliance with the limit values from his customers. It can be used whenever the limit values of an installation have to be checked: during the acceptance of new installations, during measurement campaigns or when searching for the causes of EMC problems.

Max Ulrich
Managing Director Camille Bauer Metrawatt AG


